
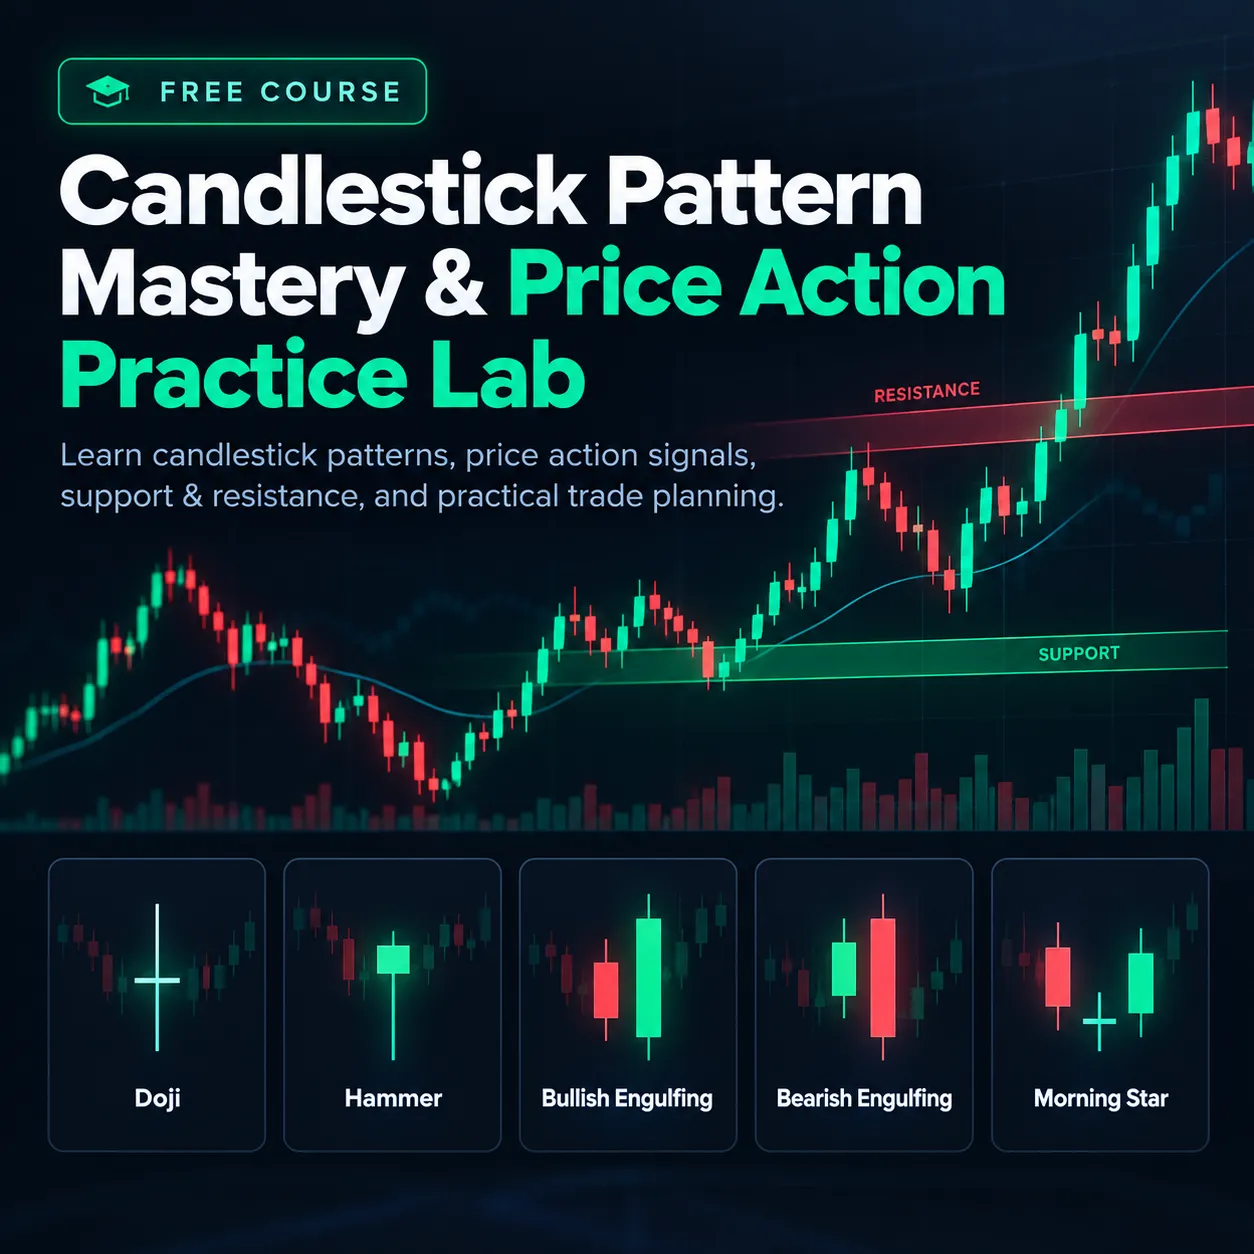
Candlestick Pattern Mastery & Price Action Practice Lab
Trading BasicsA FREE illustrated practical course covering candlestick patterns, price action, chart context, entries, stops and disciplined pattern testing with 20 visual lessons and 40 exam questions.
Course overview.
Candlestick Pattern Mastery & Price Action Practice LabFREE illustrated course | 20 chart-led lessons | 40-question exam | Beginner to IntermediateMove beyond memorizing candle names. Learn how to read OHLC structure, analyze rejection and engulfing patterns, distinguish false breakouts, and evaluate setups alongside support/resistance, trend, volume, risk and journaling. Every text lesson contains an original, embedded PNG illustration and a practical assignment.Topics coveredCandlestick anatomy, timeframe confirmation, wicks and dojis.Hammer, hanging man, shooting star, inverted hammer and engulfing patterns.Piercing line, dark cloud cover, star patterns, soldiers and crows.Inside/outside bars, false breakouts and potential liquidity sweeps.Support and resistance, pullbacks and volume interpretation.Entry/stop/target planning, position sizing, journaling and final case study.Format and certification20 self-paced reading steps with embedded diagrams, practice prompts and a 40-question multiple-choice final exam. Passing score is 75% (30 correct). Certificate eligibility is subject to Chainbey Learning’s completion and verification requirements.Important disclosureIllustrations are educational schematics, not real-time prices. Pattern names and historical examples are not trade recommendations or guarantees. Markets and leveraged products carry risk of losses, including the full amount at risk.
Course curriculum.
20 learning steps
Step 1 · The Anatomy of a Candlestick TEXT · Preview available
The Anatomy of a Candlestick
Learning objectives
Read open, high, low and close without guessing what happened inside the bar.
Illustrated chart guide — The Anatomy of a Candlestick

Diagram is a simplified educational illustration; it is not market data or a trading signal.
Core lesson
A candlestick summarizes four observations for a fixed period: the first traded price (open), highest (high), lowest (low), and last traded price (close). The real body spans open to close; upper and lower wicks extend to the extremes. A bullish body has close above open; a bearish body has close below open. Color is a visual convention, not a buy/sell instruction. Two charts can have identical OHLC bars yet very different intrabar paths.
Worked example
An open of 100, high of 106, low of 98 and close of 104 makes a bullish body from 100 to 104, an upper wick of 2 and a lower wick of 2.
Practical assignment
Mark OHLC on ten candles from a chart of your choice. Record both body size and full range before interpreting direction.
Common error to avoid
Mistaking the top of a green body for the candle high; interpreting a candle as a complete tick-by-tick record.
Self-check checklist
- I can describe this pattern in measurable terms.
- I can identify its timeframe, context and opposing levels.
- I can state an alternative explanation and a no-trade condition.
- I can define invalidation and a limited risk amount.
Key takeaway
A candle compresses prices; it cannot reveal intrabar order sequence.
Step 2 · Timeframes, Closes and Candle Confirmation TEXT · Preview available
Timeframes, Closes and Candle Confirmation
Learning objectives
Understand how candle boundaries change the same market story.
Illustrated chart guide — Timeframes, Closes and Candle Confirmation

Diagram is a simplified educational illustration; it is not market data or a trading signal.
Core lesson
A 5-minute candle and a 1-hour candle aggregate different intervals. A pattern that appears at 10:35 may vanish before an hourly bar closes. Session boundaries, exchange timezone, missing trades and liquidity affect candles. Define whether your setup uses a forming candle, its confirmed close or the next candle. Multi-timeframe study should use only higher-timeframe bars completed by the decision timestamp to avoid look-ahead bias.
Worked example
A 15-minute candle trades above 102 at minute five but closes below 101. Calling it a confirmed breakout at minute five assumes knowledge you did not yet possess.
Practical assignment
Record the same 60 minutes as twelve 5-minute bars and four 15-minute bars; compare the apparent reversals.
Common error to avoid
Mixing bar-close and intrabar rules without stating which one triggers a trade.
Self-check checklist
- I can describe this pattern in measurable terms.
- I can identify its timeframe, context and opposing levels.
- I can state an alternative explanation and a no-trade condition.
- I can define invalidation and a limited risk amount.
Key takeaway
A candle-based rule must specify its timeframe and when it becomes confirmed.
Learn. Practice. Improve your skills.
Explore structured trading courses, track your lessons and build your market knowledge from your Learning dashboard.